There are many ways to grade QB’s performances. Some use statistics, others use wins and intangibles. Each of these have their flaws, of course.
Using just stats is flawed, because basic QB stats or even advanced QB stats (passer rating, EPA, etc.) don’t tell us anything about the teammates they are playing with and how good they are. A QB that has top 10 numbers in major categories may have much better receivers as a QB that is only top 20 in such stats.
Judging by QB wins is also flawed as well – for the same reason. A QB who is a “winner” may have a defense that actually gets stops at the end. Think of how people were calling Jalen Hurts a winner in the first half of the 2023 season… just for the Eagles to crash spectacularly by season’s end. Justin Herbert may not be perfect, but he has had more games over the years than any other QB where his defense has given up a score after he, the QB, had scored a game-tying or go-ahead score..
As we all know, regular counting stats are flawed. Counting stats don’t ever really explain why things happen, they just explain what happened. Meaning that counting stats aren’t good enough.
Here at TakeThis, we prefer to use relative criteria for judging players. Oftentimes, sports fans are needlessly (but intentionally) extreme with how they judge players.
We go by a mantra; how will did you perform, relatively to what was around you?
At this time, we have to rely on NFL’s Next Gen Stats – as they are one of the closest metrics we have for getting high-context statistics. PFF is another option as well.
This is essentially going to the prototype of a new stat: Adjusted Passer Rating. (APR). The full name for this article will be “Passer Rating Relative to Team Receivers and Running Backs Quality”. (Note: this is the early stages of the statistic. There will be better versions in the future!)
Right off the bat we’ll acknowledge that this has some flaws (as it is a very early-stage prototype); as of right now it does not account for the offensive line – which is very important in QB performance. Additionally, it doesn’t include the quality of the offensive scheme, which also matters.
To make a full comprehensive statistic that accounts for everything will take awhile (it is something we are working on… so follow our website and leave comments for more!).
But for now, this will do.
Receivers
We are using receiver separation percentage and cushion percentage (how much space they create/get before catching the ball). While this doesn’t tell us exactly how they are getting open, it still does show how much help the QB has – he either has elite receivers that can get open, or a great offensive playbook that is able to scheme receivers open – and vice versa if they are not open.
And we will also use WR AVG YAC Above Expectation – how much more yards after the catch is the receiver getting compared to others. This determines if the QB has amazing playmakers that can generate a big play out of nothing.
Running Backs
For the running back, it is similar. A RB that faces 8+D in the box with regularity is usually a really great running back, and that will help open things down field.
However, there are times where this isn’t the case; if the QB’s receivers aren’t good, and he himself isn’t very good, then the defense can stack 8+ in the box because they know the offense can’t beat them downfield.
And that means the QB is being helped by the RB.
As a result, we combine 8+D and YPC to account for this. If the running back has decent YPC despite facing a defense focused on stopping him, then he is a great running back. We will use “Defense-adjusted YPC” to determine how much yards per carry they are getting relative to the defense they are facing.
So overall, we are basically going to determine how good the QB is playing relatively to what he has around him.
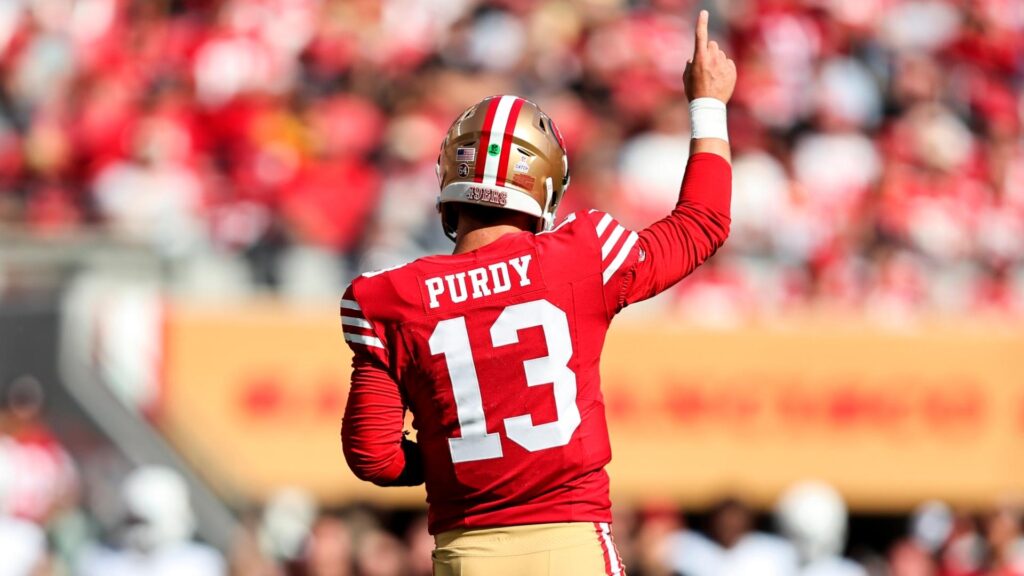
This helps us avoid overrating or underrating guys. So a QB like Brock Purdy won’t be punished OR propped up by this stat – because it’ll judge him on how well he did given how good his receivers were. It’s basically going to buoy up many QBs whose passer ratings were deflated by some of the above reasons (receivers who didn’t get separation, or weren’t reliably getting open and catching).
The Experiment
These are our variables we are using, and they come from NFL’s Next-Gen Stats website (https://nextgenstats.nfl.com/stats/rushing#yards and https://nextgenstats.nfl.com/stats/receiving#yards):
- YPC – rushing yards per carry
- 8+D% – percentage of rushing plays with a running back where the opposing defense has 8 or more defenders in the box
- CUSH – distance (yards) between receiver and defender pre-snap
- SEP – distance (yards) between receiver and defender at the time of the catch
- CTCH% – percentage of passes caught relative to the number of targets for a receiver
- +/- YACABOVE – average yards after catch above expectation
These should all make sense to long-time NFL football fans. The logic behind it is pretty simple: if the running back is really good, it’ll draw defenders closer to the line of scrimmage to focus on stopping the run (8+ defenders in box), thus opening up more spacing downfield for the QB to pass the ball (since the defense is focused on the running back.
If receivers have good cushioning or separation, they are obviously going to get open – making it easier for the QB to complete passes. If the catch rate is high, and their YAC above expectation is high… the passing offense is going to be more efficient… thus boosting passer rating.
To make this project work, I had to manually copy, merge, and transform some data.
Next-Gen Stats gives us info for individual players like so:
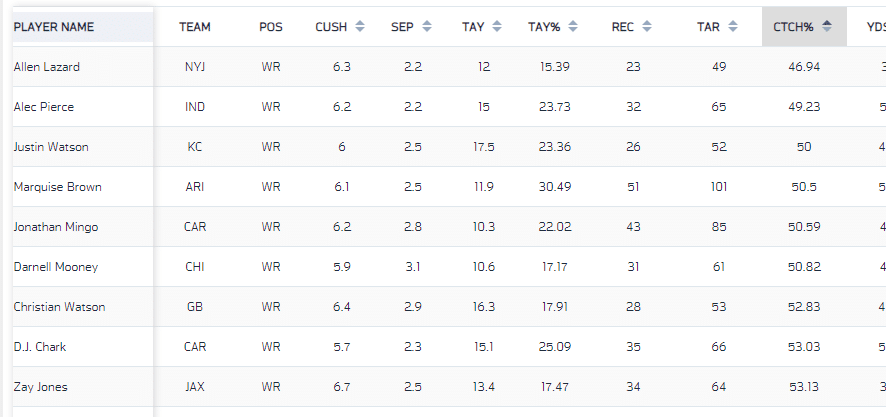
Obviously, this would be cumbersome when adjusting for each QB. So I decided to simply average out the receivers to represent the team averages for each QB (using Power Query > Group By).
Using Python, I uploaded the dataset to get the team averages.
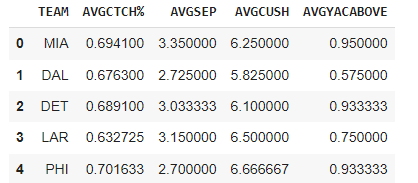
And combined all the datasets to begin the process.
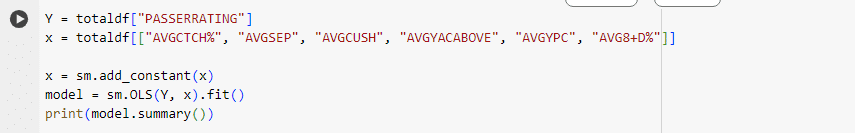
I will be using multiple regression to figure out the weight each variable has on our target variable, the passer rating. This won’t be perfect, as the sample size is pretty small – (about 40 QBs), and we are using a small amount of specific variables (the 6 outlined above.)
This is our result running the code:
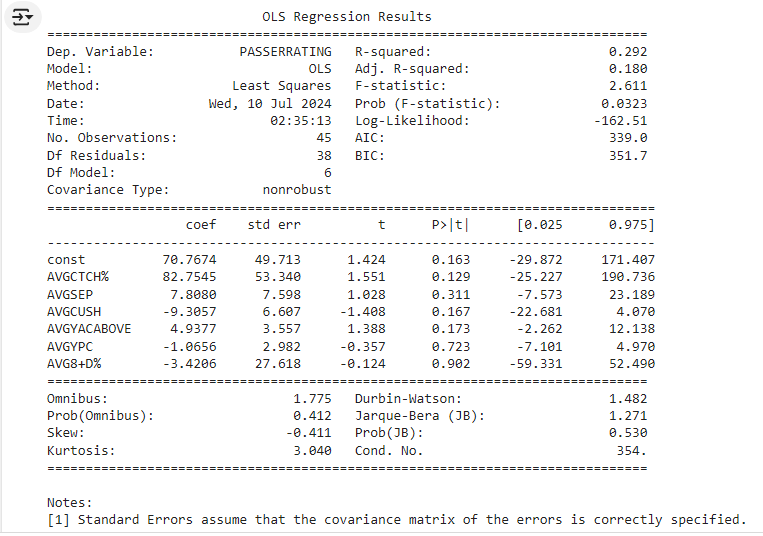
As we can see, the r-squared of 2.92 is weak. So these factors have some influence on passer rating, but not a strong or very significant influence at all.
Again, our sample size is small, and it does not include offensive-line play.
And more importantly, one could argue that the r-squared should be relatively small, as a large r-squared value would imply that every QB in the NFL is virtually interchangeable and all are solely reliant on their receivers and running backs. Which we know isn’t the case. Patrick Mahomes and, say, Zach Wilson, would* not* perform equally if they both had equally great receivers and running backs. Because as an indivdiual QB, Mahomes is better than Zach Wilson in ways that go beyond the teammates they have around them – decisiveness, accuracy, processing, etc.
The goal is to see the subtle changes in rankings for QBs. We will not show off the adjusted passer rating rankings.
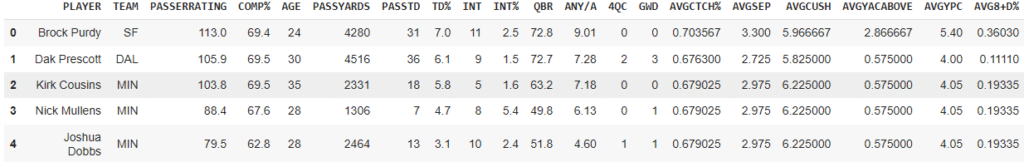
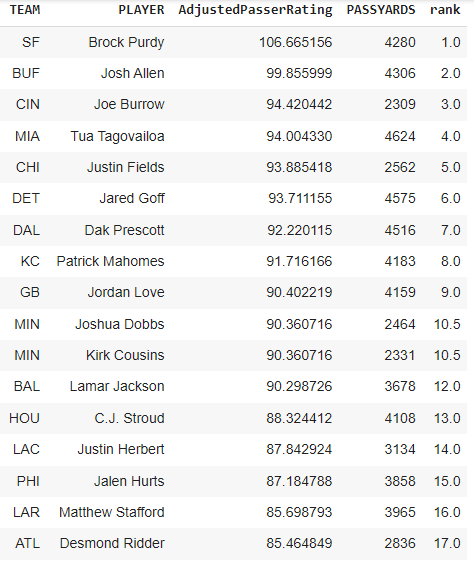
After plugging in formulas, we can now generate a new dataset featuring the adjusted passer rating for the QBs, filtered to show only QBs who eclipsed over 2000 passing yards on the season.
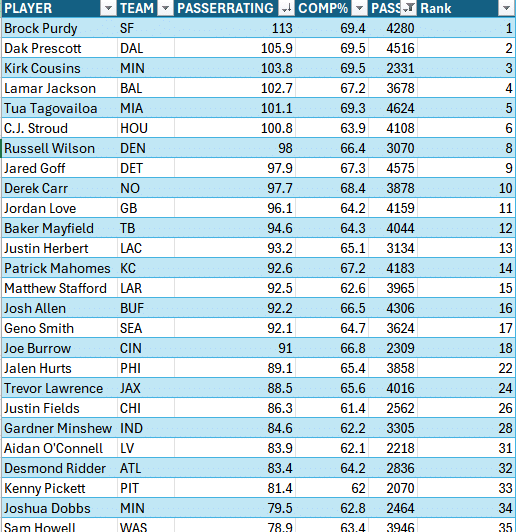
This is the list (the “rank” column on the left is the rank for the passer rating, not pass yards):
*WARNING* the results will both make sense and be polarizing!
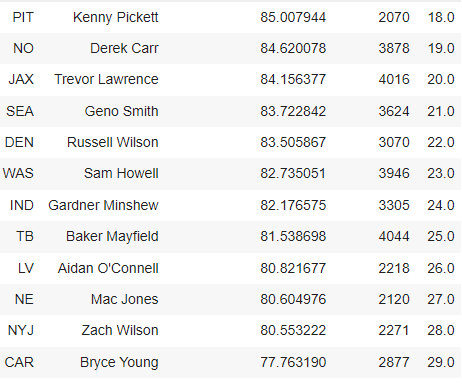
And this is the list of QBs with the regular passer rating.
Quick Observations
So there are some questions we can ask, and some ideas we can express. Many of them are surprising, and many of them will make people roll their eyes.
In comparison to the original passer rating rankings, a few things jump out.
- Brock Purdy is still number 1. Purdy really did a great a job with the supporting cast he had. Even if he did have a great team, Purdy did not underacheive with it.
- Both Mahomes and Allen go up. This makes sense, as both of them dealt with some issues this season; Mahomes’s receivers were generally unreliable outside of Kelce, and for Allen, it took Buffalo some time for them to finally find a reliable rushing attack, and wide receiver Steffon Diggs struggled after the first month of the season.
- Justin Fields is boosted significantly. At first glance this seems surprising, but it makes sense – many of Field’s negative plays were events that the Passer Rating metric is not affected by – sacks and fumbles. Field’s raw passing numbers were not good, but it appears that having better receiver separation and catching would have boosted his his pure passer rating.
Lamar Jackson is also hurt. He goes from 4 to 12. Jackson’s rushing numbers already weren’t included in the passer rating metric, but now by accounting for the mild effect of open receivers, it scales down his passer rating a bit. Perhaps there were plays where Lamar run and got yards on but receivers were open? Instead of the regular passer rating metric ignoring that, this adjusted one slightly penalizes him.
Joe Burrow is boosted by this – which shouldn’t be a surprise, because Jamar Chase and Tee Higgins are not known for their speration. As great as they are as big play contested catchers, Burrow still needs to have impeccable timing and accuracy when throwing to them.
As mentioned before, in our view, stats only show what’s happening – they don’t explain why. So we can’t draw definitive conclusions about who is better than who from this dataset. But we can connect it to real life.
Conclusion
Overall, as we alluded to earlier, passer rating is just a stat – it doesn’t explain why something is happening. Many who watch Fields will tell you that he has issues processing the field quickly enough – he is indecisive, and will take bad sacks. Passer Rating won’t care about this though. Which shows you why Passer Rating is flawed.
This preliminary metric (which is still in its infancy!) seems to basically say “you are who you are”. Yes the Chiefs’ receivers struggled and had drops, but based on even the eyetest, Mahomes himself was still a little shaky in the regular season. Games like the Christmas day game against Raiders, Sunday night against the Packers, etc. Did not have much to do with his receivers – Mahomes just had too many sloppy plays in those games. (This could also be a fault of how NextGen Stats views catch% vs the amount of drops receivers actually had. Catch% does not specifically account for drops, it’s overally completions and targets.)
As mentioned before, Burrow is boosted here because his receivers – Chase and Higgins – are better at catching contested, tight balls than they are at getting open and creating separation. And this metric did not utilize the contested catch rate.
As usual, it is always best to see where the model can be improved. The fact that the r-squared is low could mean that those variables really aren’t as impactful on a QBs performance as we like to think – but it could also mean that we need a larger sample size of data and a larger amount of variables for more accurate testing, perhaps spanning up to 5 years. Just 1 year of data for some 40 QBs, with just 5-6 variables doens’t tell the whole story.
In the future, we will try to add variables such as the types of defensive coverages faced (if possible), the actual amount of drops receivers had, and also the schedule (strength of schedule, defensive ranking of opponents played), etc.
Leave comments below for any feedback, suggestions, etc. !

This needs some more work but I like what you’re trying to do here. When are you gonna make a follow up, it’s been months.
you know, as a bears fan, who’s been moved on from Fields… this is both ridiculous and logical at the same time. Fields may have blowed but if he just had people that could catch the ball he would have been decent.
I’m happy we got some good receivers this year for caleb.
This seems like a cool idea, im interested in seeing where it’s headed
P.s. suck it Brock Purdy haters :p