Statistics record information about what is happening. This person scored points, blocked shots, caught passes, etc.
But they cannot be used exclusively to draw conclusions. They do not actually tell the whole story. This is because statistics – especially basic counting statistics – are inherently vague and blurry. They are not precise because they only record the outcome events – they leave out context. Basic statistics can tell you what happened not how or why it happened. So statistics should not singlehandedly be the basis of your opinions in sports.

The short of it is that stats themselves can be influenced by playstyle, supporting cast, scheme, schedule, etc. They by themselves do not tell the story of a player. They partially tell their ability, but not all of it. Stats leave out a lot of context. Let’s just use some examples.
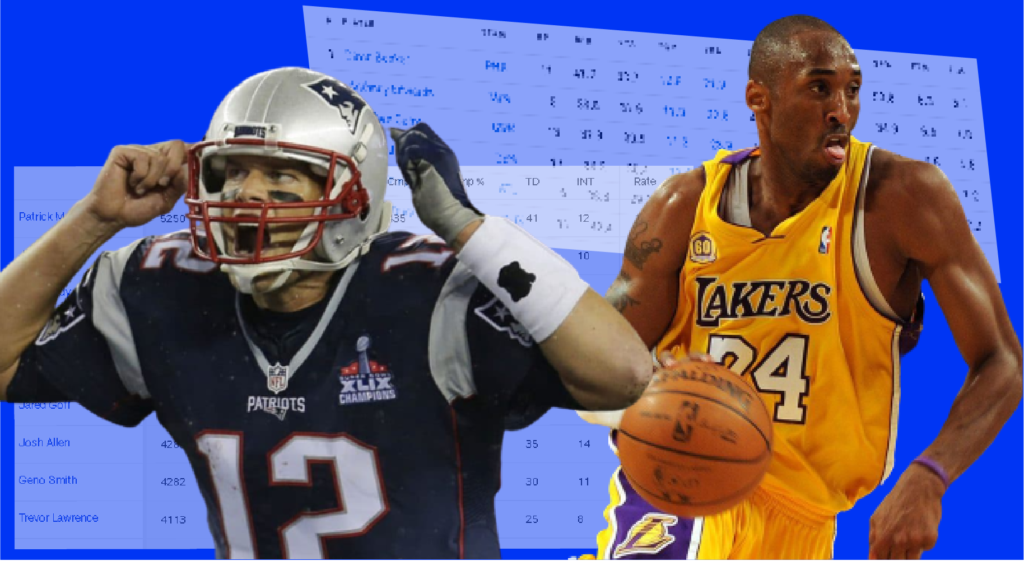
In recent times, there have been some people who have criticized Tom Brady‘s GOAT status – they like to say that Tom is only the GOAT because of his longevity and rings, and they say that he was never the best QB in the league – they’ll use stats like passer rating and EPA to show that other players like Peyton Manning and Aaron Rodgers were better, and that Patrick Mahomes was better than he ever was. And they’ll say that his rings were largely the product of his defenses, his coach, and luck.
Here’s the thing. You know how people like to rally against using rings to judge a player because they feel it leaves out context? Well, that can – and does – apply to stats as well. Tom Brady’s statistics – which were still excellent by the way, and some of which do show he is the GOAT if you include playoff statistics – were only lower than those guys for a couple of reasons beyond his control. Early in Brady’s career, the team was built more on the defensive side of the ball. In addition to having a defensive-minded head coach, the Patriots hemorrhaged much of the talent from their 1996 Super Bowl team by 2001; Curtis Martin at RB was traded, TE Ben Coates was retired, and WR Terry Glenn was suspended midway through the season. Additionally, veteran Troy Brown split time at receiver amongst other positions. So it took time for the Patriots to slowly build back their offensive talent, drafting WR Deion Branch in 2002, and TE Ben Watson in 2004 and acquiring veteran RB Corey Dillon in 2004. (And in 2004, Ben Watson missed virtually all of the season, and Deion Branch missed half of the regular season as well).
In comparison, Peyton Manning in his rookie season had HOF receiver Marvin Harrison, and HOF RB Marshall Faulk. And then the Colts then drafted Edgerrin James at RB (who would also make the HOF). And then Reggie Wayne in 2002.
In case you get the wrong idea, the point is not that Peyton Manning is “overrated”. It’s that the statistics do not tell the whole story between the two. Supporting cast can affect statistics. After all, when Brady threw for 50 TDs – was he all of sudden a better player than he was in 2006? or 2005? or 2004? Or did they upgrade the receivers and open up the playbook by acquiring Randy Moss and Wes Welker?
Additionally, the Patriots also ran the ball at the goal-line a lot during Brady’s tenure. This matters, because, well, it deflates Brady’s Touchdown pass total, which then affects his passer rating and A/YA. So then it makes Brady look like a “worse” player compared to his peers even if his performance and play was just as great.
This is an example of how a team’s strategy can affect statistics. As you see, the Patriots ran the ball at the goalline at a much higher rate than other teams. If they were pass, Brady’s TD numbers – and other corresponding QB stats – would increase, and give him more MVP level seasons.
Brady made up 19 of those 171 rushing TDs (11%).
If the Patriots were to run the ball at the goal-line at league average during this time, they would have roughly 100.5 (rounded up to 101) rushing TDs. (And that’s with us keeping the high outliers like the Panthers and Saints!) That’s a difference of 70 rushing TDs… 62 if you discount Brady’s own rushing TDs.
Which then means that if you were to haphazardly add those touchdowns back into Brady’s passing touchdowns, he would have an extra 62 passing touchdowns during this 13 year period. 62/13 = extra 4.7 TDs a year. This could actually make a notable difference on Tom Brady’s stats – and may even bump him up in All-Pro and MVP nods. And this is rudimentary – this isn’t taking into account games Brady has missed, nor is it even taken into account how the team’s scheme plays a role in this as well.
Also, playstyle can affect statistics.
As you see above, Rodgers’s EPA percentage of passes to the middle of the field with 20+ air yards (basically, a difficult, big time throw) does not increase much when trailing. This is very important to highlight, because it shows a sense of conservative play on Rodgers’s part. This isn’t meant to criticize Rodgers or say he’s bad; it’s to show how misleading certain stats like completion percentage or TD-INT ratio can be. If a QB is more more risk-averse, it can protect their efficiency stats. One can probably come up with an excuse for Rodgers’s numbers during this time frame, I’m sure. But even then, that would still further show that statistics do not represent everything. It shows how certain playstyles can affect statistics. Certain playstyles can look better statistically than others, even if they are not more conducive to helping a team win.
So now, this isn’t to say that Brady is objectively the best QB and that you are wrong if you think he’s not. If you value sheer physical talent and mobility, then it makes sense to prefer someone like Aaron Rodgers, John Elway or Patrick Mahomes.
We can do this in the NBA as well. People have rightly pointed out that AST-TO (assist-turnover) ratio is overvalued. AST-TO is basically the TD-INT ratio of the NBA, and both are efficiency metrics. Having a great AST-TO ratio does not inherently mean you are a better player. This is because even having a high amount of assists in itself does not guarantee you are the best passer.
For instance, Chris Paul and LeBron James are both great players, and future hall-of-famers. Chris Paul’s career assist averages are higher than LeBron James’s career assist-averages. But many still view LeBron James as a better all-time passer and playmaker. And this isn’t even a knock on Chris Paul.
And back to the AST-TO point: Having such a large ratio may sometimes mean that you are being too conservative.
So overall, we can see that statistics don’t display ability with high precision. Stats can obviously show whether a play is bad, mediocre, or good, of course. But at a deeper level, they do not show who is great or elite with precision.
And logically, many of these (playstyle, team strategy, supporting cast) can take place at the same time.
A great example: a player like Kobe Bryant did not have great 3PT shooting percentages: this has lead people to assume that he is not a great 3PT shooter in general. (As in, his 3pt shooting ability isn’t very good.) This is an example of how stats do not tell the whole story.
Here’s the reality: Kobe Bryant was a great 3PT shooter. So why did the stats not reflect that?
Because of Kobe’s shot selection. Kobe often took many difficult shots, which includes difficult 3-pointers. The 3pt shot in itself tends to yield lower raw number percentages than 2pt shots despite being worth more. So when you take a difficult version of a shot that already has a lower number percentage value, it’s going to make you look worse than you are.
One can then say “hey, that means Kobe’s 3pt shooting percentages still reflect on Kobe’s game: his shot selection!”
Sure this is true – however, that is not the same as Kobe not being a good shooter in terms of ability. Again, as implied stats can tell you something. But they do not tell you everything. And what they don’t tell you is that Kobe is a great shooter, that took difficult shots – partly because he was an aggressive scorer, and partly because he had to be an aggressive scorer, at times. The Lakers did not have that many great backcourt shooters Kobe could pass to and rely on, particular in the middle of his prime (the mid 2000s). The Lakers roster in the late 2000s did rely on him making tough shots – there were not other players that could help generate an open 3pt shot for Kobe. So again, his 3pt shooting percentage wasn’t amazing, but many people who watched Kobe play knew the ability was there. The stats just didn’t reflect that because of the aforementioned circumstances.
Let’s use another example of both playstyle and scheme affecting things. Steph Curry is a great playmaker. But the way he makes plays for his team isn’t easily reflected in most counting stats. His off-ball movement and cutting leverages the threat of his 3PT shot, causing defenses to key in on him frequently, allowing his teammates to play 4-on-3. There are plays where Draymond Green will get an assist – and to be fair, he would make a really good pass! – that was still set up earlier by Curry’s movement, or even Curry allowing himself to be doubled and making the timely pass. Curry’s assist stats don’t jump out on a page, and thus do not tell the story of his playmaking contributions to the offense.
Conclusion
After all… there is a reason that advanced stats exist. Whether it’s stuff like DVOA, QBR, or EPA in the NFL, or RAPM and VORP in the NBA, they have all been invented to add more context and also more information. Context about the opponent, extra information about the player’s performance, etc. This is also while the polarizing PFF grades were invented; to give more precision to performance by accounting for situation, and to measure things basic counting stats can’t measure like offensive line blocking grades (it’s hard to assign a number to a successful block).
This is even why Next-Gen stats were created. The whole point is to add precision and measure very subtle interactions that go a long way to adding more information. Traditional counting stats, for example, may not be able to measure how many open threes a team is missing or just how bad a football team’s receiving corps is. But more advanced tracking stats (using cameras) can measure and define these things. We can get a metric for open 3-pointers or see how much separation a team’s receivers are getting.
Statistics are not bad. They just aren’t (yet?) precise enough to be used as a way to assess players on a micro level, which is a point in and of itself. The closer in skill the players you are comparing, the more context you need when comparing them. Once you get beyond deciphering a terrible player from a good player, you need more than stats to differentiate the greats, because great players each unique traits that made them great.
This is why you have to use statistics as a jumping board to tell you more, instead of just jumping to conclusions and forming solidified opinions about them that you staunchly defend. Never assume you know everything!


