The following analysis utilized Python and Google Colab. To see the full analysis with code, click here.
Football is a team sport, but that doesn’t mean that there aren’t certain players who impact the game more than others.
There has long been a debate about the merits of epople who like to judge individual Quarterbacks for their wins. Some say that it is silly to do so since QBs are just 1 of the 11 men on the field for their team at once, and that they are not even on the field for half the game (as their defense takes over after a change of possession).
Others say that QBs can and should be judged for wins, as it is no secret that a QB’s performance significantly impacts a game; after all, the QB touches the ball every play on offense, and can often change the plays. Their proficiency at passing (and even running) can manipulate the opposing defense, and open things up for their teammates. Their play can also help their own defense out, as scoring points and draining the clock makes it easier for their defense (as the other team will often have to start passing to get back in the game). A QB can also help his punter and his kicker out by moving down field, and mask flaws that the team has. Additionally, if the QB has the ball last, they can get a game-winning drive to win the game.
To test if wins being a QB stat has any validity, we can run some correlation and regression tests to see if QB performance correlates with their team winning.
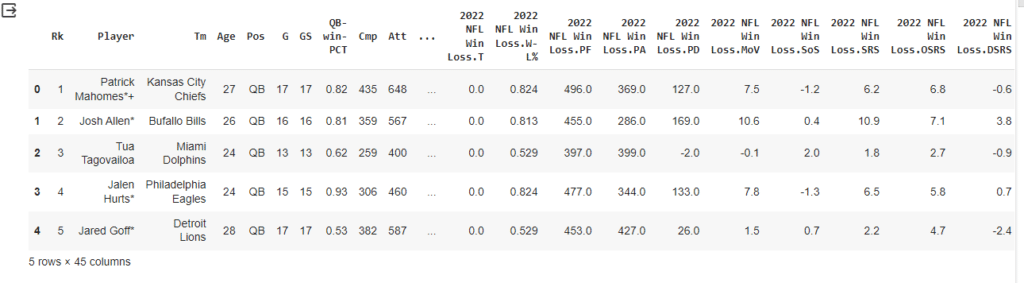
We have a dataset based on data from Pro Football Reference:
https://www.pro-football-reference.com/years/2022/passing.htm
https://www.pro-football-reference.com/years/2022/defense.htm
https://www.pro-football-reference.com/years/2022/#all_team_stats
I used Excel’s merge functions to merge them together as necessary.
There are many stats that are important for a QB – how many TDs they throw, how many interceptions, etc. And there are metrics like Passer Rating (Rate), QBR, and Adjusted Net Yards per Attempt (ANY/A) that attempt to evaluate a QB’s performance by combining multiple variables together.
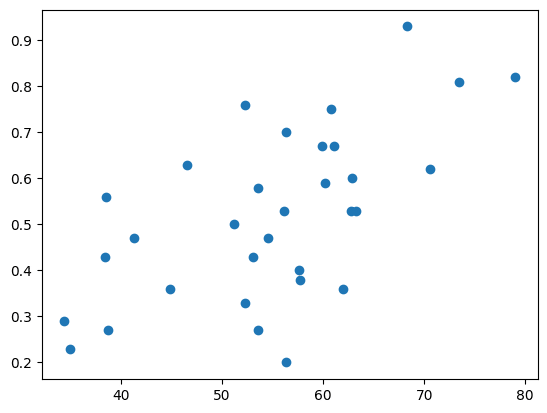
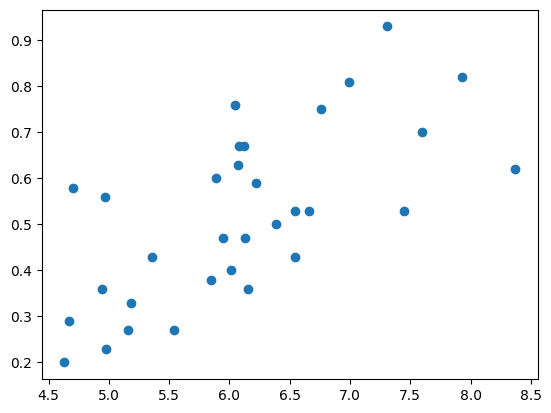
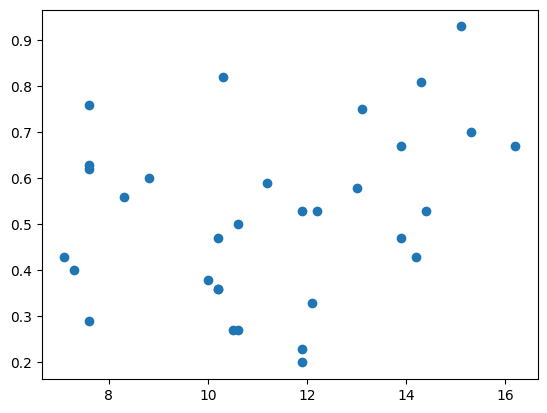
Let’s pull up some basic charts to see if we can find any association with QB performance and win-pct.
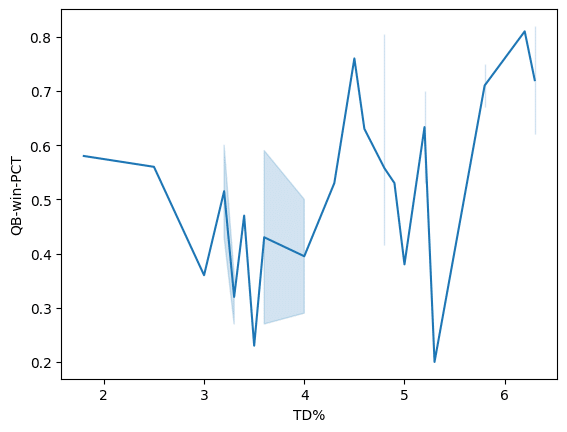
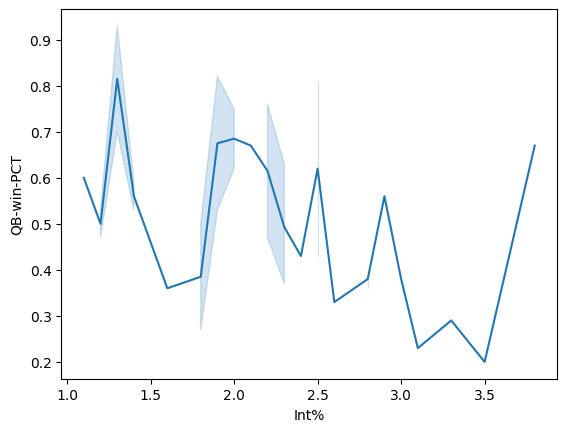
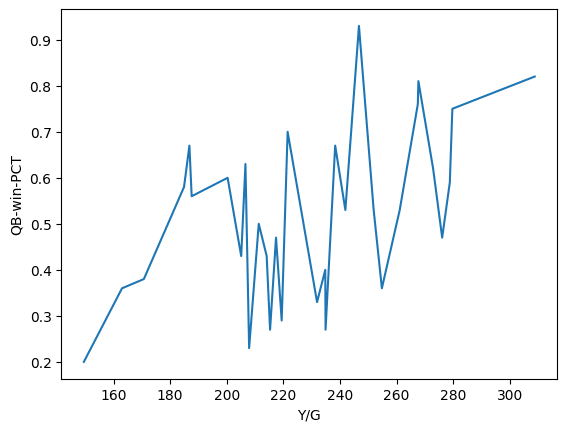
As we can see, there are some obvious trends we can point out. For many of these stats (Yards per game, QBR, Rate, etc.) it seems visually that on average, the higher the stat is, the higher the win percentage is.
But the data is still “muddy”, per to say. Let’s use Python’s correlation libraries to find out the correlation between these QB stats and winning.
from scipy.stats import pearsonr
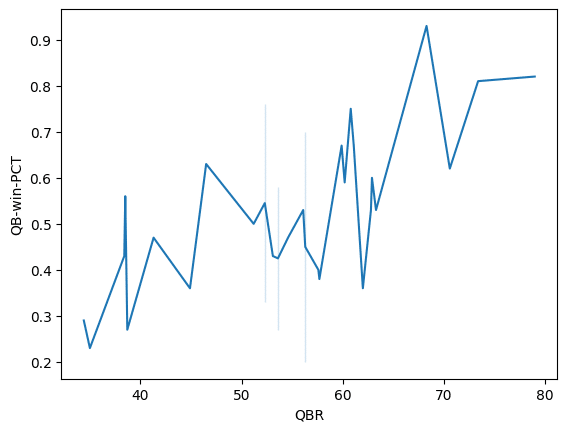
qbrcorr, _ = pearsonr(qb_wins["QBR"], qb_wins["QB-win-PCT"])
plt.scatter(qb_wins["QBR"], qb_wins["QB-win-PCT"])
print('Pearsons correlation for QBR: %.3f' % qbrcorr)
plt.show()
qbrcorr, _ = pearsonr(qb_wins["QBR"], qb_wins["QB-win-PCT"])
plt.scatter(qb_wins["QBR"], qb_wins["QB-win-PCT"])
print('Pearsons correlation for QBR: %.3f' % qbrcorr)
plt.show()
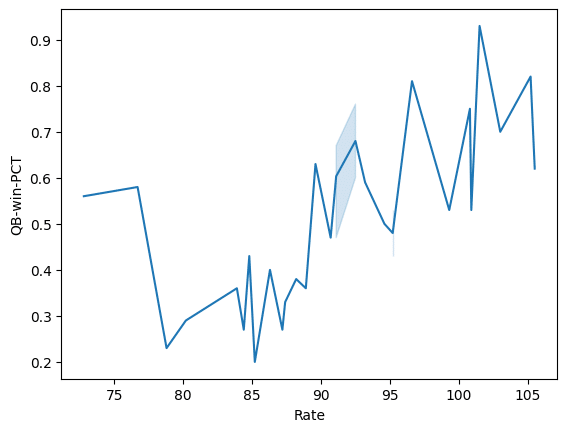
ratecorr, _ = pearsonr(qb_wins["Rate"], qb_wins["QB-win-PCT"])
plt.scatter(qb_wins["Rate"], qb_wins["QB-win-PCT"])
print('Pearsons correlation Passer Rating: %.3f' % ratecorr)
plt.show()
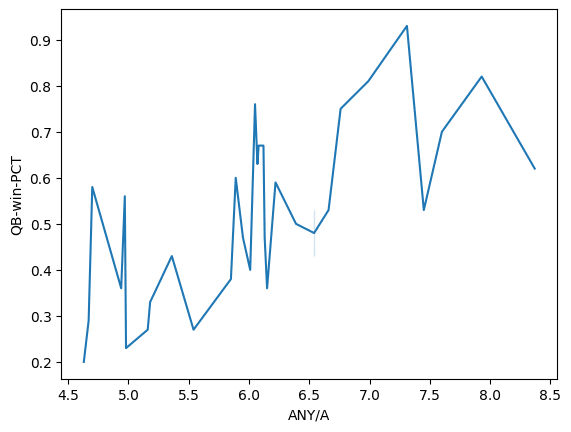
anyacorr, _ = pearsonr(qb_wins["ANY/A"], qb_wins["QB-win-PCT"])
plt.scatter(qb_wins["ANY/A"], qb_wins["QB-win-PCT"])
print('Pearsons correlation for ANY/A: %.3f' % anyacorr)
plt.show()
Pearsons correlation for QBR: 0.612
Pearsons correlation Passer Rating: 0.616
Pearsons correlation for ANY/A: 0.673
Analysis
So as we can see, there is an obvious association between QB performance and wins. All of the metrics have positive correlations. And of the stats above, ANY/A (Adjusted Net Yards per Attempt) seems to have the strongest correlation of the group ofr 0.67, which is a moderately strong correlation.
This may seem obvious to many football fans, but there are often plenty of fans that may flip flop back and forth about the importance of QB position when convenient.
Most people will acknowledge that the better your QB performs, the more likely his team is to win the game on average. And vice versa (if your QB has a terrible game, it’s harder for your team to win). But many are quick to point out that a bad defense can cost a QB many seasons. (They can point to some of the years that QB Drew Brees had in the late 2000s as evidence of this.)
Defense
So to make this analysis more whole, lets combine this dataset with statistics from the team’s defense, along with individual defensive players.
Using Excel’s merge function, we can combine tables with a common column – in this case, the team name – to match the team’s defensive performance with the QB. (In this case, we are comparing the whole team defense with the performance of the individual QB. This will be very telling.)
Let’s look at some correlation charts based on our defensive data.
pacorr, _ = pearsonr(qb_and_defense["PA"], qb_and_defense["QB-win-PCT"])
plt.scatter(qb_and_defense["PA"], qb_and_defense["QB-win-PCT"])
print('Pearsons correlation for Points Allowed: %.3f' % pacorr)
plt.show()

yacorr, _ = pearsonr(qb_and_defense["Yds.1"], qb_and_defense["QB-win-PCT"])
plt.scatter(qb_and_defense["Yds.1"], qb_and_defense["QB-win-PCT"])
print('Pearsons correlation for Yards Allowed: %.3f' % yacorr)
plt.show()

sccorr, _ = pearsonr(qb_and_defense["DefSc%"], qb_and_defense["QB-win-PCT"])
plt.scatter(qb_and_defense["DefSc%"], qb_and_defense["QB-win-PCT"])
print('Pearsons correlation for Scoring Drive Percentage: %.3f' % sccorr)
plt.show()

tocorr, _ = pearsonr(qb_and_defense["DefTO%"], qb_and_defense["QB-win-PCT"])
plt.scatter(qb_and_defense["DefTO%"], qb_and_defense["QB-win-PCT"])
print('Pearsons correlation for Turnover Percentage: %.3f' % tocorr)
plt.show()

expcorr, _ = pearsonr(qb_and_defense["DefEXP"], qb_and_defense["QB-win-PCT"])
plt.scatter(qb_and_defense["DefEXP"], qb_and_defense["QB-win-PCT"])
print('Pearsons correlation for Defense Expected Points: %.3f' % expcorr)
plt.show()
Pearsons correlation for Points Allowed: -0.564
Pearsons correlation for Yards Allowed: -0.444
Pearsons correlation for Scoring Drive Percentage: -0.395
Pearsons correlation for Turnover Percentage: 0.284
Pearsons correlation for Defense Expected Points: 0.346
So as we can see, although there are clear associations (for instance, the more the points given up, the worse the win percentage is), none of them the correlations are are strong.
The correlation for points allowed and yards allowed are only -0.564 and -0.444, respectively (and the other metrics are much lower). These are mild-to-moderate correlations, in comparisons to some of the QB values above of which many were over 0.6.
This shows that QB performance is a stronger predictor of the team winning games than the defense.
Let’s see if we can find some more useful information here.
simplified_table = ["Rate", "QBR","ANY/A", "4QC", "GWD", "PA","Yds.1","DefEXP","DefSc%","DefTO%","QB-win-PCT"]plt.figure(figsize=(12,8))sns.heatmap(qb_and_defense[simplified_table].corr(), annot=True,fmt='.2f')plt.show()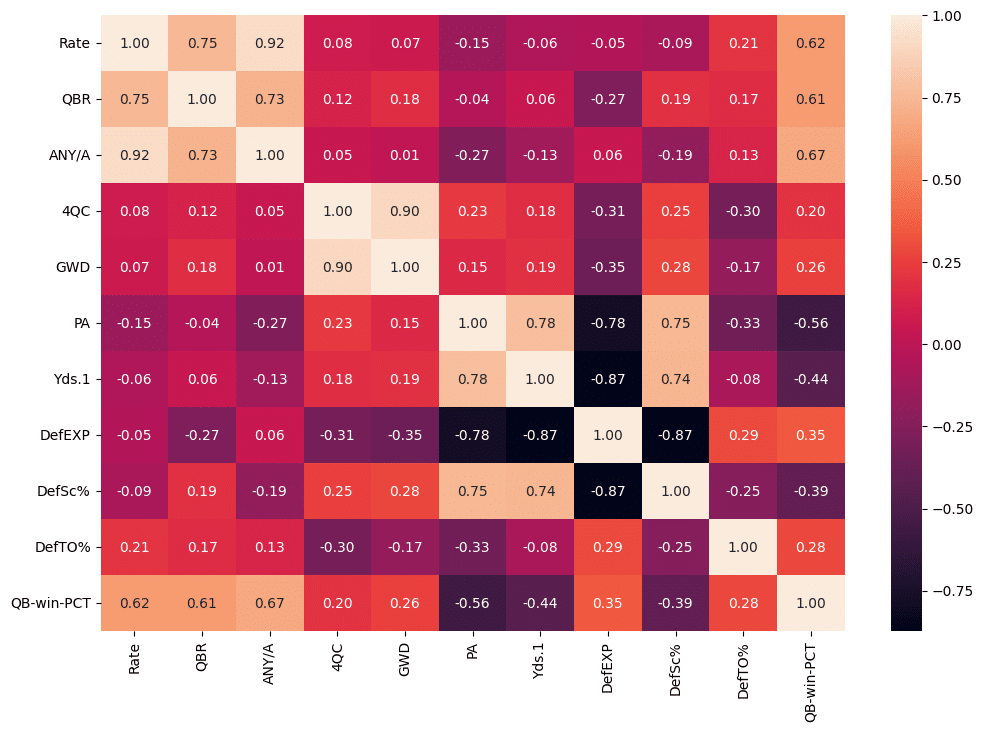
As outlined like this, it shows that QB performance is more important than the defensive performance for team winning. However, this does not mean that the defense is unimportant. The defense on average does have a mild correlation with in percentage.
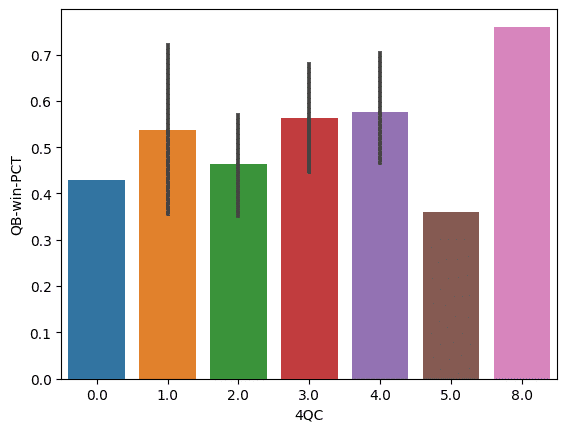
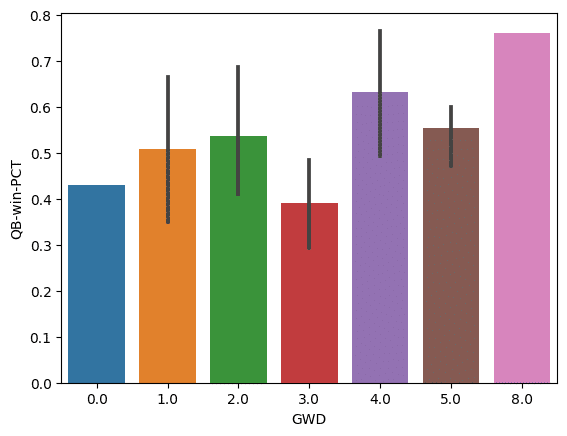
This heatmap does show that there is a relatively weak correlation between QB performance and defense-points allowed. Meaning that on average, we can’t really say the the QB’s stats affects the defense. 4th Quarter Comebacks and Game-Winning Drives do seem to correlate a little bit more with defense than the other stats. Why that is is up for further anaylsis.
This doesn’t inherently mean that the QB’s overall performance can’t impact the defense. This is because these stats – Rate, QBR, ANY/A – they do not tell the whole story of what a QB provides to his team.
We would have to know other factors such as how the QB is choosing to attack the defense. For example – is the QB gaining yards with big plays, or with a series of more methodical plays? This makes a difference because it can dictate how much rest the QB’s own defense gets when they are off the field.
We also need information on the roster itself, which leads to the major point that will be outlined in the conclusion below.
Final Analysis
The problem with basic stats is that they do not show the effect that multiple players have on a play, and they don’t account for things that are harder to measure or that may even happen off the field. A player’s completion percentage and yards are heavily skewed by the receiving corps around them. This is what makes statistical analysis so difficult at times, and is why people love using the “eye test”. (And the eye test itself has its own flaws… because it assumes that the viewer actually understands and notices all of what they are seeing on the field, and not just the blatant flashy plays… and that the viewer themselves aren’t particularly watching with biased eyes.)
The important thing to know – as with many stats – is that there is always a need for more context. Stats do not tell the whole story – as we outlined in our article. Football fans – heck, sports fans – heck, people in general! – often see statistics and immediately jump to hard-line conclusions. The thing to remember is that statistics give us information, but they do not tell the whole story.
So if we want to be technical and consistent, this statistical analysis shows that there is a correlation between the QB have good numbers (EPA, ANY/A), and their team winning. If a QB has worse numbers, it there is a strong correlation with their team losing.
And stats like EPA and ANY/A can show whether a QB is playing well or bad in a general sense. And they can show who is a good QB or bad QB in a general sense over a long sample size. So if your QB is good, that is a strong predictor of your team being good.
But they are not perfect stats, as they leave out some context – such as how good the rest of the roster is around the QB. It’s why there are a few QBs on the list with decent EPA/ANY/A numbers whose team win percentage ended up not matching the level of play, and vice versa. Obviously having good teammates matters – football is a team sport, of course. What this stat hints at however is that it that QB play is more important.
With how few QBs went against the general trend, it seems like the rest of the supporting cast (teammates and coaching) would have to be really bad consistently in order to waste good QB play. Even then, it can sometimes be made up for with game-winning drives – as shown by Kirk Cousins and Justin Herbert.
One can say that QB’s that perform well are likely to have better overall teams – thus meaning the overall team matters. But again, there are teams with good defenses that still struggled to accumulate wins. The 2022 Patriots had a better defense than the Vikings, but had a significantly worse win-percentage because at the end of the day, the Vikings had much better QB play.
So generally, the better the QB play (or more specifcally his numbers), the more bad the rest of the team would have to be to waste it. Otherwise, great QB play generally leads to their team winning.
Therefore, wins can be considered a QB stat, generally speaking. In an individual game it might not be, but for season or career, it usually will be, as most QBs in the league inherently won’t have an outlier supporting cast that will completely waste their great performances or make up for their terrible play (as outliers are outliers for a reason.)
To make this analysis to complete, we could need Next-Gen Stats – as they can measure factors that aren’t recorded by traditional stats such as how easily receivers are getting open. Pro Football Focus’s PFF Grade tries to account circumstances like this as well.
This overall shows the problem with stats – they still only measure a fraction of what we see, let alone the whole reality. QBs that have good defenses may still be able to thrive with worse ones; certain QBs that have bad defenses are not always unlucky – sometimes they need more support on offense, which makes it harder for the team to build a good defense around them. And sometimes, they can be unlucky of their team fails to draft good players around them.
Another idea would be to use a multi-year sample to determine how it holds up overtime – are their certain QBs that can make the playoffs even with mediocre-to-bad QB play? We would still need to know the quality of the receiving corps.
This all sounds complicated, but the truth still does point to QB play being the most impactful.
Thanks for reading! In the future, we can probably do a more sophisticated analysis.
To see the full analysis with code, click here.


I like the analysis. People always sway either extreme on this topic, so I like how you say that GENERALLY speaking, wins are a qb stat, over time, and acknowledge that a really bad team can overrule a great QB.