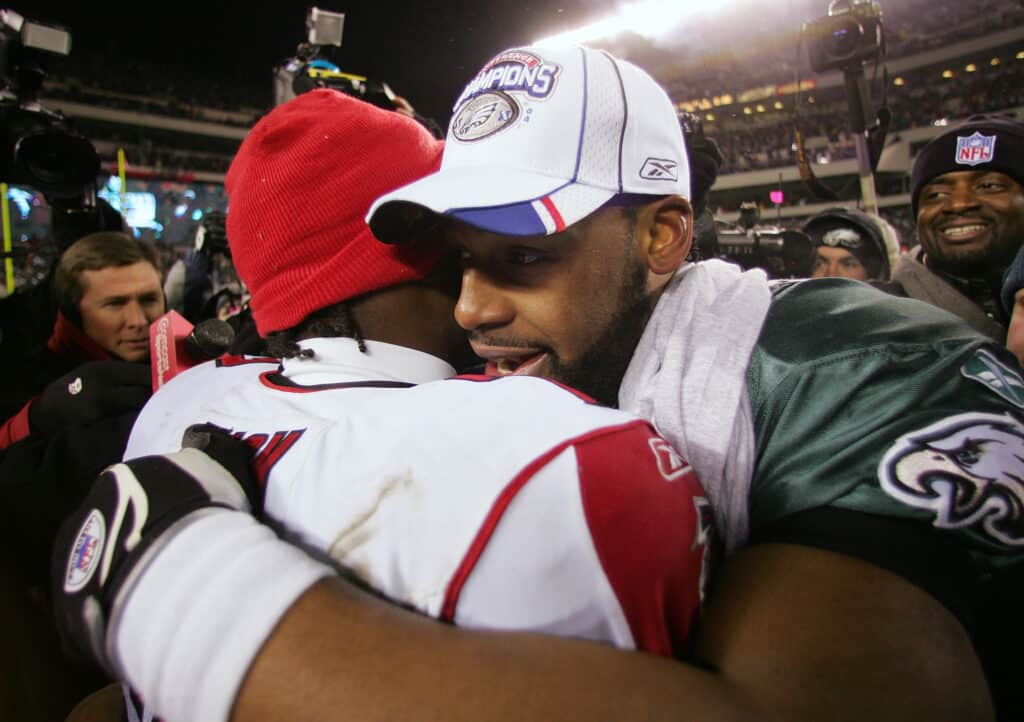
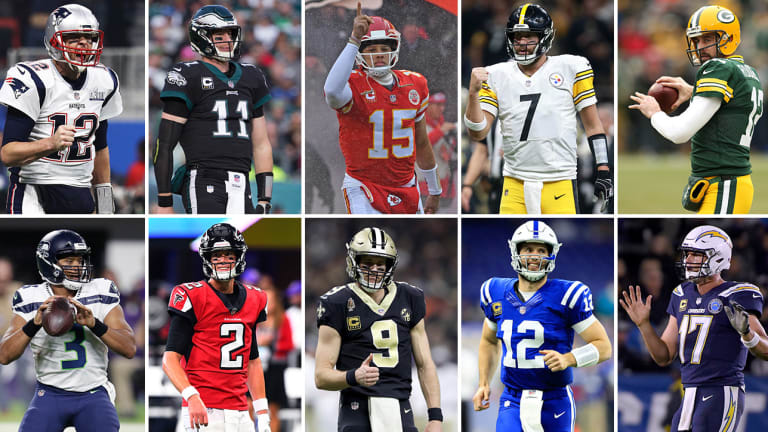
This is the win record differential for many long term starters that came into the league in the early 2000s or at least became starters in the early 2000s.
Donovan McNabb
| Season | Team | Record | Projected | +/- | Context |
| 1999 | PHI | 1-5 | 1.82-4.18 | -0.82 | had offensive minded coach Andy Reid for the whole time in the Eagles |
| 2000 | PHI | 11-5 | 11.04-4.96 | -0.04 | TE Lewis made an all pro |
| 2001 | PHI | 10-6 | 11.30-4.70 | -1.30 | TE Lewis and LT Thomas made a pro bowl |
| 2002 | PHI | 7-3 | 5.99-4.01 | 1.01 | Lewis and RT Runyan made a pro bowl. Thomas made an all-pro |
| 2003 | PHI | 12-4 | 9.65-6.35 | 2.35 | 4 gw drives. RB Westbrook emerged |
| 2004 | PHI | 13-2 | 9.97-5.03 | 3.03 | Terrell Owens arrived and made an all-pro. Westbrook and Thomas made a pro bowl |
| 2005 | PHI | 4-5 | 4.04-4.96 | -0.04 | got hurt later. Owens did not finish the season either. |
| 2006 | PHI | 5-5 | 5.24-4.76 | -0.24 | Owens left. G Andrews made an all-pro |
| 2007 | PHI | 8-6 | 8.10-5.90 | -0.10 | Westbrook made an all-pro. G Andrews made a pro bowl |
| 2008 | PHI | 9-6 | 9.47-6.53 | -0.47 | WR Jackson drafted |
| 2009 | PHI | 10-4 | 7.41-6.59 | 2.59 | yr 2 DeSean Jackson made a pro bowl, TE Celek and yr 2 WR Maclin emerged and RB McCoy drafted. LT Turner and G Runyan left but LT Peters arrived and made a pro bowl |
| 2010 | WAS | 5-8 | 5.55-7.45 | -0.55 | WR Santana Moss and TE Cooley are productive |
| 2011 | MIN | 1-5 | 2.31-3.69 | -1.31 | had offensive minded coach Mike Shanahan |
Kurt Warner
| Season | Team | Record | Projected | +/- | Context |
| 1994 | N/A | 0-0 | 0-0 | 0 | got cut |
| 1995 | N/A | 0-0 | 0-0 | 0 | not in the NFL |
| 1996 | N/A | 0-0 | 0-0 | 0 | not in the NFL |
| 1997 | N/A | 0-0 | 0-0 | 0 | not in the NFL |
| 1998 | STL | 0-0 | 0-0 | 0 | didn’t start |
| 1999 | STL | 13-3 | 11.10-4.90 | 1.90 | great stats but 0 gw drives with a great defense. Pace made an all pro from 1999-2001. RB Faulk made an all -pro |
| 2000 | STL | 8-3 | 2.72-8.28 | 5.28 | offensive minded head coach Dick Vermil is replaced by offensive minded head coach and former OC on the same team Mike Martz. had a couple of gw drives. RB Faulk made an all-pro this yr and next. WRs Bruce and Holt each made a pro bowl this yr and next. |
| 2001 | STL | 14-2 | 9.34-6.66 | 4.66 | Timmerman made an all pro |
| 2002 | STL | 0-6 | 2.95-3.05 | -2.95 | struggled, RB Marshall Faulk decline despite making a pro-bowl, and Warner had a hand injury. Pace made a pro bowl |
| 2003 | STL | 0-1 | 0.39-0.61 | -0.39 | Pace and Holt makes an all-pro but Warner didn’t have the job anyway. |
| 2004 | NYG | 5-4 | 5.37-3.63 | -0.37 | had offensive coach Tom Coughlin, RB Barber made a pro bowl |
| 2005 | ARZ | 2-8 | 3.13-6.87 | -1.13 | WR Fitzgerald made a pro bowl and WR Boldin emerged |
| 2006 | ARZ | 1-4 | 1.43-3.57 | -0.43 | Boldin made a pro bowl |
| 2007 | ARZ | 5-6 | 3.19-7.81 | 1.81 | Offensive Head Coach Ken Whisenhunt arrived and replaced offensive minded coach Dennis Green. Fitzgerald made a pro bowl. |
| 2008 | ARZ | 9-7 | 6.35-9.65 | 2.65 | Fitzgerald made an all pro this season and next. Boldin made a pro bowl |
| 2009 | ARZ | 10-5 | 7.19-7.81 | 2.81 |
Jake Delhomme
| Seasons | Teams | Record | Projected | +/- | Context |
| 1997 | NO | 0-0 | 0-0 | 0 | not in NFL |
| 1998 | NO | 0-0 | 0-0 | 0 | no in NFL |
| 1999 | NO | 1-1 | 0.42-1.58 | 0.58 | NFL Europe |
| 2000 | NO | 0-0 | 0-0 | 0 | NFL Europe |
| 2001 | NO | 0-0 | 0-0 | 0 | on the bench |
| 2002 | NO | 0-0 | 0-0 | 0 | on the bench |
| 2003 | CAR | 11-5 | 8.76-7.24 | 2.24 | 7 game winning drives. RB Davis made a pro bowl. WR Smith emerged. |
| 2004 | CAR | 7-9 | 7.01-8.99 | -0.01 | RB Davis and WR Smith hurt almost the whole yr. Muhammad made an all-pro |
| 2005 | CAR | 11-5 | 10.01-5.99 | 0.99 | WR Smith makes an all-pro |
| 2006 | CAR | 7-6 | 6.63-6.37 | 0.37 | WR Smith made a pro bowl |
| 2007 | CAR | 2-1 | 1.32-1.68 | 0.68 | offensive coordinator Davidson replaces Henning, Delhomme got hurt early in the yr |
| 2008 | CAR | 12-4 | 7.86-8.14 | 4.14 | 5 game wining drives. WR Smith, T Gross, and RB Williams made all-pro |
| 2009 | CAR | 4-7 | 4.03-6.97 | -0.03 | struggled despite C Kalili and RB Williams making pro bowls |
| 2010 | CLE | 2-2 | 2.61-1.39 | -0.61 | struggled despite C Mack making a pro bowl and a T Thomas making an all-pro |
| 2011 | HOU | 0-0 | 0-0 | 0 | bench |
Matt Hasselbeck
| Year | Team | Record | Projected | +/- | Context |
| 1999 | GB | 0-0 | 0-0 | 0 | on the bench this yr and next |
| 2000 | GB | 0-0 | 0-0 | 0 | |
| 2001 | SEA | 5-7 | 5.49-6.51 | -0.49 | had offensive minded head coach Holmgren the whole time in Seattle, RB Alexander was productive, LT Walter Jones made an all-pro |
| 2002 | SEA | 5-5 | 4.05-5.96 | 0.96 | LT Jones made a pro bowl, WR Robinson and RB Alexander was productive |
| 2003 | SEA | 10-6 | 7.61-8.39 | 2.39 | LT Jones and RB Alexander made a pro bowl, G Hutchinson made all-pro from 2003-2005 with Seattle |
| 2004 | SEA | 7-7 | 5.29-8.71 | 1.71 | 0 game winning drives, LT Jones made all-pro from 2004-2008, RB Alexander made all-pro, WR Darrell Jackson was productive |
| 2005 | SEA | 13-3 | 9.26-6.74 | 3.74 | RB Alexander won MVP, C Tobeck made a pro bowl, FB Strong made an all-pro, TE Jurevicius was productive |
| 2006 | SEA | 7-5 | 5.35-6.65 | 1.65 | 4 game winning drives, G Hutchinson left, RB Alexander regressed, C Tobeck missed half of the season |
| 2007 | SEA | 10-6 | 8.67-7.33 | 1.33 | WR Engram was very productive, C Tobeck retired |
| 2008 | SEA | 1-6 | 1.74-5.26 | -0.74 | miss most of the season, RB Alexander left |
| 2009 | SEA | 5-9 | 5.24-8.76 | -0.24 | only 1 game winning drive, LT Jones retired, defensive minded head coach Jim Mora Jr. replaces Holmgren, WR Houshmandzadeh was productive |
| 2010 | SEA | 6-8 | 5.26-8.74 | 0.74 | 0 game winning drives, defensive head coach Pete Carroll replaced Mora Jr. |
| 2011 | TEN | 9-7 | 8.29-7.71 | 0.71 | had head coach Munchak, WR Nate Washington and RB Johnson was productive |
| 2012 | TEN | 2-3 | 1.16-3.84 | 0.84 | backup from now until 2015, RB Johnson was productive |
| 2013 | IND | 0-0 | 0-0 | 0 | had defensive coach Pagano |
| 2014 | IND | 0-0 | 0-0 | 0 | |
| 2015 | IND | 5-3 | 3.80-4.21 | 1.21 | Chudzinski replaced Pep Hamilton as the OC, WR Hilton made a pro bowl |
Chad Pennington
| Season | Team | Record | Projected | +/- | Context |
| 2000 | NYJ | 0-0 | 0-0 | 0 | bench |
| 2001 | NYJ | 0-0 | 0-0 | 0 | bench |
| 2002 | NYJ | 8-4 | 7.22-4.78 | 0.78 | WR Coles emerged. Mawae made an all-pro. RB Martin productive this yr and next. |
| 2003 | NYJ | 4-5 | 4.29-4.71 | -0.29 | got hurt later. WR Coles left but WR Santana Moss replaces him and is productive. C Mawae made a pro bowl |
| 2004 | NYJ | 8-5 | 7.71-5.29 | 0.29 | Mawae and Martin both made an all-pro |
| 2005 | NYJ | 1-2 | 1.28-1.72 | -0.28 | Heimerdinger replaces Paul Hackett as the offensive coordinator, got hurt later |
| 2006 | NYJ | 10-6 | 9.28-6.72 | 0.72 | defensive head coach Mangini replaces defensive head coach Herm Edwards, Martin and Mawae left but C Mangold and LT Ferguson were drafted |
| 2007 | NYJ | 1-7 | 3.03-4.97 | -2.03 | struggled, got benched |
| 2008 | MIA | 11-5 | 8.27-6.73 | 2.73 | wildcat offense help, offensive minded head coach Tony Sparano arrived, RB Brown made a pro bowl. LT Jake Long made a pro bowl. |
| 2009 | MIA | 0-3 | 0.87-2.13 | -0.87 | struggled despite pro bowl season from T Long, got benched early |
| 2010 | MIA | 1-0 | 0.53-0.47 | 0.47 |
Michael Vick
| Season | Team | Record | Projected | +/- | Context |
| 2001 | ATL | 1-1 | 0.93-1.07 | 0.07 | primarily on the bench |
| 2002 | ATL | 8-6 | 6.96-7.04 | 1.04 | |
| 2003 | ATL | 3-1 | 1.73-2.27 | 1.27 | didn’t finish most of the season. TE Crumpler made a pro bowl |
| 2004 | ATL | 11-4 | 7.71-7.29 | 3.29 | defensive minded head coach Jim Mora replaces Dan Reeves, led 4 gw drives. Crumpler made a pro bowl. Dunn was productive |
| 2005 | ATL | 8-7 | 7.58-7.43 | 0.43 | Only 1 gw drive. Crumpler made a pro bowl |
| 2006 | ATL | 7-9 | 7.88-8.12 | -0.88 | Crumpler made a pro bowl |
| 2007 | ATL | 0-0 | 0-0 | 0-0 | suspended |
| 2008 | ATL | 0-0 | 0-0 | 0-0 | suspended |
| 2009 | ATL | 0-0 | 0-0 | 0-0 | didn’t start |
| 2010 | PHI | 8-4 | 4.18-7.82 | 3.82 | improved passer with Offensive Head Coach Reid. LT Peters made all pro. WR Jackson made a pro bowl. WR Maclin and RB McCoy were productive. |
| 2011 | PHI | 7-6 | 7.11-5.89 | -0.11 | regressed, 0 gw drives despite T Peters making all-pro and McCoy being an all-pro |
| 2012 | PHI | 3-7 | 2.72-7.28 | 0.28 | Jackson regressed, Peters missed the season, |
| 2013 | PHI | 2-4 | 1.70-4.30 | 0.30 | Offensive Head Coach Reid fired/Offensive Head Coach Chip Kelly hired. Peters, McCoy, and G Mathis made all- pro. Jackson made a pro bowl |
| 2014 | NYJ | 1-2 | 1.19-1.82 | -0.19 | C Mangold made a pro bowl. Vick was a primary backup moving forward |
| 2015 | PIT | 2-1 | 1.68-1.33 | 0.33 | WR Brown and G DeCastro made all-pro |
Takeaway
Kurt Warner and Jake Delhomme had seasons spent in the Arena Football League and in NFL Europe. Those seasons are counted on their career charts because if they are left out, then it gives them an unfair advantage when calculating the averages for their career record differential, respectively. They were out of the league because they were deemed to not be good enough to be in the NFL at the time and to receive development elsewhere. If they were good enough to be in the league as backups or as starters, then those years would have been accounted for anyway, so they weren’t going to be awarded for having those years not counted for.
McNabb was basically slightly below average to average (even with Reid and good protection) when it came to performing relative to the wins an average quarterback would have. He was good around 2003-2004 and 2009 when he had very good, skill position players but showed he couldn’t have a higher peak (4.5+ wins above the average) or at least sustain it for multiple seasons (like in 2005 before getting hurt).
Warner basically had a few peaks with the Rams when Marshall Faulk was at his peak. Having very good receiving support and an offensive scheme were just compliments, since Warner was basically below average (relative to the wins an average quarterback would have gotten) when Faulk declined and when he went elsewhere. He performed 2–3 games above average when offensive-minded Ken Whisenhunt arrived in Arizona. His receiving support (albeit young) was only complimentary to his success, since he was average even with it before Whisenhunt arrived, albeit wide receiver Fitzgerald did also get better also.
When Delhomme and his offensive skill position players were healthy, he had some good seasons (2-4 wins above average), such as in 2003 and 2008. Some of his average years were met with injuries to him or his best player on offense (ex. Steve Smith). After 2008 (specifically the disastrous 2008 Divisional Round game), he was below average even with solid offensive support.
As a primary starter, Hasselbeck had defensive support that was decent as the average quarterback would have ranged from finishing a game under .500 and even a game above .500. His defenses were bad in his last couple of seasons in Seattle. Hasselbeck was basically average in Seattle until Shaun Alexander became an elite running back from 2003-2005. The better Alexander peaked, the higher Hasselbeck’s record differential became. He had around 2 to slightly over 3 wins above average during that 3-year stretch but never peaked higher.
Hasselbeck’s record differential slowly declined all the way to below average in the following seasons in Seattle when Alexander quickly regressed and eventually left the team. He finished just under a game above average in Tennessee when running back Chris Johnson was productive but not elite. He had a decent season, winning almost 2 games above average in 2015 when Chudzinski was the offensive coordinator in Indianapolis. Hasselbeck is productive when he has strong running back support. However, he only peaks at just being good but not great when he has an elite running back with star performances from other offensive players that help the running back. Otherwise, Hasselbeck is only just average at best when it comes to winning compared to the average quarterback in his situations.
Pennington alternated between healthy and unhealthy seasons, which hurt his win averages). When healthy, he was slightly below average to average despite having pretty solid offensive support. His one pretty good season was when the Dolphins utilize the Wild Cat offense for the first time when the league had no answers to it.
Vick was mostly slightly below average to barely above average (barely a game above the average QB in wins). Utilizing his dual threat abilities, he was good in 2004 but fell back to average in terms of wins with the same offensive star support. He was excellent to great in 2010 with added offensive support as he had a record differential of close to 4. However, he fell back to slightly below average/average whether the same offensive supporting cast was healthy (2011 and 2013) or unhealthy (2012).
Click here to read part 3 for more quarterback’s record differentials.


